research Publications
Data Viz, Uncertainty & Explainable AI
Andrea Brennen, Ab Mosca, Remco Chang, Nina Lopatina. How Good is Your Machine Translation? Quality Estimation for Direct User Feedback. [DRAFT]
Evaluation of individual and ensemble probabilistic forecasts of COVID-19 mortality in the US.
Ensemble Forecasts of Coronavirus Disease 2019 (COVID-19) in the U.S. [Contributing member of COVID-19 Forecast Hub Consortium.]
Andrea Brennen. 2020. What Do People Really Want When They Say They Want “Explainable AI”? We Asked 60 Stakeholders. In Extended Abstracts of the 2020 CHI Conference on Human Factors in Computing Systems (CHI EA ’20). Association for Computing Machinery, New York, NY, USA, 1–7. DOI:https://doi.org/10.1145/3334480.3383047
Brennen A, George D, Sieniawki G, Reed C, Lutz CS, Dahlgren FS, Biggerstaff M. Viziflu: an open-source tool for visualizing seasonal influenza forecasting results and uncertainties. In: Epidemics 7th International Conference on Infectious Disease Dynamics: 2019 December 3–6.
Andrea Brennen and Stephanie Tuerk. 2018. An Instrument for Evaluating Uncertainty Visualization Techniques. In Extended Abstracts of the 2018 CHI Conference on Human Factors in Computing Systems (CHI EA ’18). Association for Computing Machinery, New York, NY, USA, Paper LBW010, 1–6. DOI:https://doi.org/10.1145/3170427.3188649
Brennen, A. (Ed.). Data by Design. IQT Quarterly, Vol 7, No. 4. 2016.
Barto, William C., Andrea L. Brennen, Laura Herrera, Nathaniel M. Jones, Scott Pudlewski, Brooke Shrader and Andrew P. Worthen. Demo: routing overlay for reliable communication in networks with blockage. MobiHoc ’14 (2014).
Andrea L. Brennen, David Danico, Raul Harnasch, Maureen Hunter, Richard Larkin, Jeremy Mineweaser, Kevin Nam, B. David O’Gwynn, Harry Phan, Alexia Schulz, Michael Snyder, Diane Staheli, Tamara Yu: A novel display for situational awareness at a network operations center. CoRR abs/1412.3768 (2014). VAST Challenge (IEEE) 2013 Honorable Mention.
A. L. Brennen, C. E. Fossa, T. G. Macdonald, S. W. Arbiv and W. C. Barto, Worth a Thousand Bits: Visual Encoding of Tactical Communication Network Data, MILCOM 2013 – 2013 IEEE Military Communications Conference, San Diego, CA, 2013, pp. 1334-1340, doi: 10.1109/MILCOM.2013.227.
Bouman, O., Brennen, A., J. Snavely, R. Murphy. Ole Bouman (Ed.) The Office for Unsolicited Architecture. Volume, No. 14: Unsolicited Architecture. 2008.
Select Presentations
Data Visualization in Practice
10 Things I’ve Learned About Explainable AI. Presented at closed events in Washington, DC (2019) and Menlo Park, CA (2020).
Making Use of Multiple Models: Visualizing Infectious Disease Forecasts. Presented at Centers for Disease Control & Prevention, Atlanta, GA (2019); and Visualization In Practice Conference, Ft. Belvoir, VA (2019).
What Visualizing Flu Forecasts Taught Us About Representing Uncertainty. Presented to World Health Organization (WHO) Influenza Incidence Analytics Group (2019).
Visualizing Uncertainties in Conflict Event Data. Presented at Visualization in Practice Workshop, IEEE VisWeek, Berlin, Germany (2018).
Rethinking Network Visualization. Presented at Visualization In Practice Conference, Ft. Mead, MD (2018).
Visualization with the Data Journey Platform. Presented at Bill & Melinda Gates Foundation Grand Challenges Annual Meeting, Washington, DC (2017); and BMGF Healthy Birth, Growth & Development Workshop, New Delhi, India (2017).
Exploration vs. Explanation: Designing Better Data Stories. Presented at Bill & Melinda Gates Foundation Visual Data Science Workshop, Seattle, WA (2017).
Visualization Design 101. Presented at Initiative on the Digital Economy Workshop, MIT (2016); and US Gov. Data Science Training Course, McLean, VA (2015).
105 Data Visualization Tools. Presented at IQT CEO Summit, Monterrey, CA (2016).
Design Strategies for Data Visualization. Presented at Nieman Conference, Marquette University (2014).
A Process for Designing Cyber Visualizations. Presented at Cyber & Net-Centric Workshop, MIT Lincoln Laboratory (2014).
articles & select blog posts
Data & AI Design
Why IQT Made the COVID-19 Diagnostic Dash App. Modern Data. 2020.
Explaining: The Risks of Black-Box Decision-Making. Interview with Fiddler Labs CEO Krishna Gade. High Stakes Design. 2020.
Explaining: Outlier.AI’s Auto-Generated Data Stories. Interview with Outlier.AI CEO Sean Byrnes. High Stakes Design. 2020.
The Benefit of Simple Models. Interview with statistician Tommy Jones. High Stakes Design. 2019.
Confusion Matrices and Interpretable ML. Interview with data scientist + neuroscientist Nina Lopatina. High Stakes Design. 2019.
Visualizing Flu Forecast Data with Viziflu. High Stakes Design. 2019.
Explainable AI: what is it and who cares? Interview with IQT VP Peter Bronez. High Stakes Design. 2019.
10 things I’ve learned about Explainable AI. High Stakes Design. 2019.
AI is a High Stakes Design Problem. High Stakes Design. 2019.
Explaining “Explainable AI”. IQT Technology Brief. 2019.
Design, Human Capital, and the Value of Leadership. Interview with John Maeda. IQT Quarterly, Vol 7, No. 4: Data by Design. 2016
On Our Radar: Data is a Design Problem. IQT Quarterly, Vol 7, No. 4: Data by Design. 2016
A Memorial for Forgetting. With C. Ernsten. Abitare. 2010.
On the Fringe of Science. Volume, No. 25: Architecture on the Moon. 2010.
GAG: Green Architecture Guide. With Z. Lamb. Volume, No. 18: After Zero. 2009.
Exhibitions
Architectural Design
Sao Paolo Biennale. Design work included in “Unsolicited Architecture” Exhibition at the Dutch Pavilion (2011).
Ecole Nationale Superieure D’Architecture de Toulouse. Design work included in “Urbanities Inattendues” Exhibition (2010).
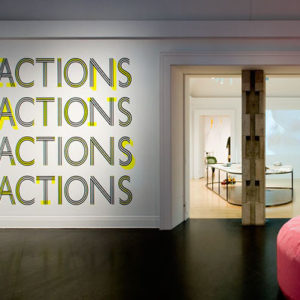
Graham Foundation for Advanced Studies in the Fine Arts, Chicago. Design work included in “Actions: What You Can Do with the City” (2010).
Canadian Center for Architecture, Montreal. Design work included in “Actions: What You Can Do with the City” (2010).
MIT Media Lab, Cambridge. “Arctic-tecture for the Global Commons” (2007).
International Architecture Biennale, Rotterdam. Design work included in “Form and the City” Exhibition (2006).
Venice Biennale. Design work included in “Torino 2050” Exhibition at Italian Pavilion (2006).